
Market Attribution Modelling

Objective
One of our biggest FMCG clients has hundreds of brands and each brand has thousands of products. They started their eCommerce business in the later half of the last decade and by 2020, they were spending c.$100M on digital marketing across various platforms like Amazon, Walmart, Kroger, etc. The business challenge was that while the brands and business verticals knew the Sales for each brand and product, they did not know how much of these sales were as a result of digital marketing on these platforms, i.e. they did not know the “market attributed sales” (in other words, sales due to digital marketing alone) and market attributed ROAS for the products and the brands.
The goal was to create a forecasting model to optimise ROAS so that marketing spend could be optimised at a product and brand level. The initial focus was to develop the models for Amazon and Kroger based on the marketing spend for them.
The analytics model development accounted for factors like:
- Online sales
- Promotions
- Stock availability (or out of stock)
- Seasonality (weekends, holidays, etc.)
Model Development Approach
Business Flow, Data Preparation and Exploratory Data Analysis
One of the first things we did was have multiple learning sessions with the marketing teams to understand how campaigns are run and the KPIs are of interest for them. This helped the development team understand the nuances and limitations of the campaign management process.
One thing that stood out was that campaigns were run based on the experience of the marketing manager. If the marketing manager is less experience, the tendency to frequently change the campaign spend and duration of the campaign was higher, i.e. campaigns were run in an ad hoc manner. This introduced a degree of randomness in the data which made it challenging from a model development perspective.
Another thing we observed is that some ASINs (Amazon equivalent for a UPC or SKU) were randomly discontinued and the same product was assigned new ASINs. There was no rational explanation or logic provided by Amazon when questions were asked. Our interpretation was that Amazon teams also didn’t know how the process works. As a result of these anomalies, the final dataset was relatively smaller and instead of all the products, it was agreed to focus on products whose data quality was evaluated to be good. By good, we mean, the dataset met all requirements of good data quality as defined by DAMA based on different parameters.
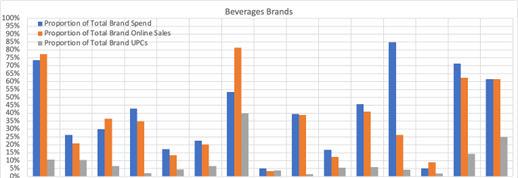
We performed exploratory data analysis (EDA) to understand the profile of different attributes like:
- Online and total sales along with their ratio
- Marketing spend
- Product hierarchy
- Date range for the dataset
- Number of unique UPCs/SKUs
- Data profile for various marketing attributes like clicks, impressions, click through rates, etc
- Data types for all attributes
Initial perception was that we could develop a time-series model to predict future sales at product and brand level but the kore we studied the data, the more we believed that time series model for all products was not possible and a weekly forecasting model was a good initial approach to understand the model performance.
CatBoost, SHAP and Bayesian Optimisation using MCMC
The dataset had many categorical variables like packet size, total weight, day, week, month etc. along with continuous variables like sales, impressions, clicks, etc.
There are several tree-based models which are used for feature engineering, i.e. for establishing the importance of an attribute on model’s predictive capability. Attributes with strong positive or negative importance indicate that the attribute has a strong influence on the target variable (in this case, online sales and ROAS/ROI).
For clarity, ROAS is defined as the ratio of online sales to marketing spend and ROI is defined as the ratio of the difference between online sales and marketing spend to the marketing spend. Studying the impact of the features on online sales would in turn imply they impact ROAS as well as ROI.
CatBoost supports the use of Shapley functions to identify attributes which had strong influence on online sales to reduce noise and focus on optimisation of a fixed number of features from a campaign perspective. This helped reduce the number of attributes along with the model complexity by eliminating many second and third order interactions.
Once feature engineering is completed and critical attributes finalised, the actual model was developed, initially using Bayesian Optimisation with Markov Chain Monte Carlo approach. It was a heuristic approach where the number of chains used was 3 which in simple terms implies that each sales curve needs to converge at least 3 times for the result to be deemed as robust and reliable.
Given the probabilistic nature of the problem, it meant that this approach is compute intensive and time consuming at the same time. The pros and cons of using Bayesian optimisation with MCMC can be reviewed online for better understanding of the framework.
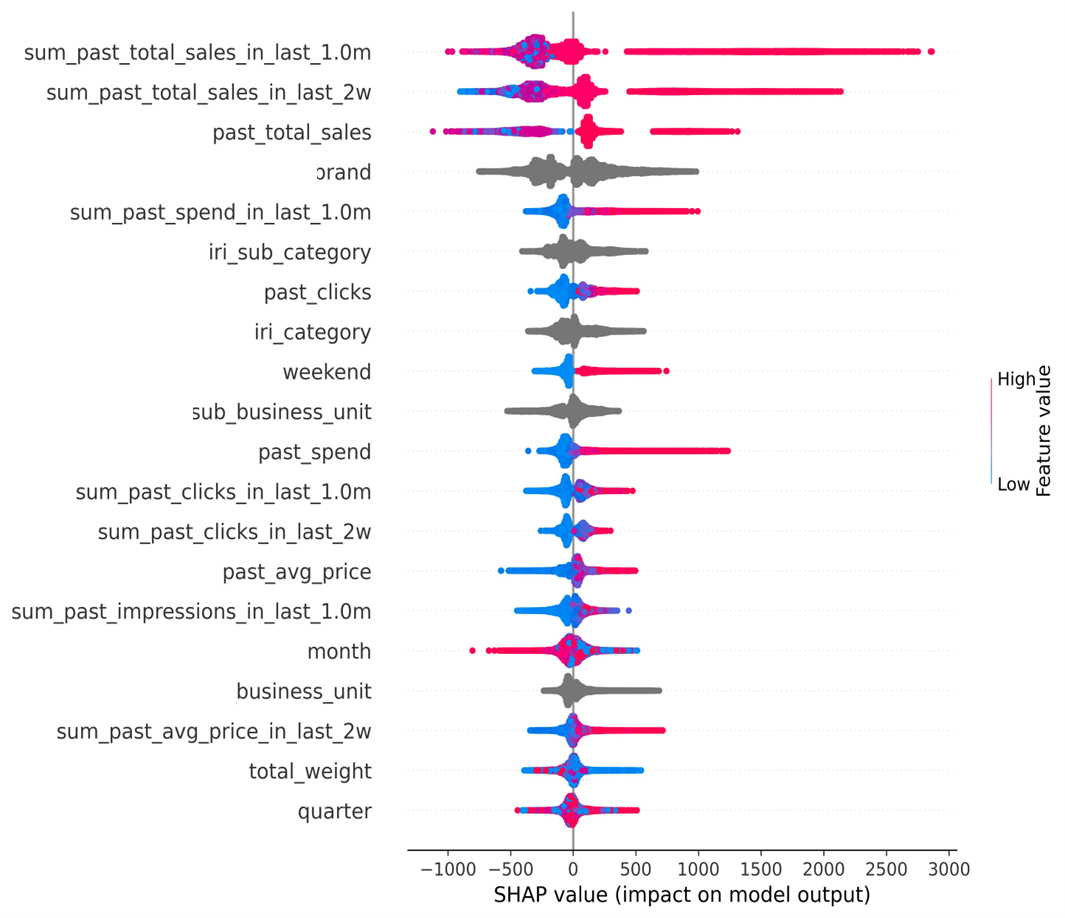
Output from Shapley Functions
To give an idea of the model runtime, it took about one week for the model to converge the results for selected products followed by an assessment of the results to ensure they are valid from a business perspective.
Observations
An initial review of the model indicated that the ROAS is maximum when spend is low, which in theory makes sense but is not relevant in practice. As spend is increased, the ROAS decreases and sales flatten out which implies that the impact of marketing trails off.
Variation of ROAS with marketing spend for different products
To have meaningful implementation of the model results, we took the current spend for each product on a weekly basis to check where it ties on the ROAS plot and based on that advised the marketing team to either increase or reduce the spend – to optimise ROAS.
A/B Testing
Once the results were validated and model approved for use by Sales and Marketing teams we planned A/B testing for select products to understand the uplift in ROAS.
The client had sales teams distributed based on region and divisions for the US market. We studied different divisions for total sales for the product and identified divisions and products where the sales were similar in volume. Once the UPCs and divisions were identified, the Sales team down selected the products that could be used for A/B testing to ensure the testing doesn’t impact the sales volume significantly to mitigate business risks.
The idea of A/B testing was to continue running campaigns for one division using the existing marketing processes while changing the spend for the other division based on model recommendation and the marketing choice of the operating point for that UPC. This testing lasted for 8 weeks.
Conclusions
Analysis of the sales result from A/B testing conclusively showed that there was a gross uplift of 40% in ROAS for the products and brands marketed on Kroger’s platform whereas there was 6% uplift in ROAS for products and brands marketed on Amazon.
Remarks
Given the proprietary nature of the topic, no code is available to share, however; this article gives an overview of the entire process emphasising the need to partner and work closely with the sales and marketing teams to ensure that model development accounts for nuances in business processes which impact the model outputs and predictive capability.