
Insights, Predictions & Actionable Strategies

Introduction
In today’s competitive telecommunications industry, customer churn is a persistent challenge. With the rise of alternative service providers and increasingly savvy customers, businesses must prioritise retention to maintain growth. Predicting and reducing churn not only helps to safeguard revenue but also allows companies to improve customer experience by addressing the root causes of dissatisfaction.
In this case study, we explore how advanced machine learning techniques, particularly churn prediction models, can help telecommunications (Telco) companies reduce churn. We’ll walk through the data analysis, modelling and insights, demonstrating how these insights can lead to actionable strategies for improving customer retention.
What is Customer Churn ?
Customer churn refers to the loss of customers over time, often as a result of customers deciding to leave for another provider. For Telco companies, this might include customers cancelling their mobile contracts, switching internet providers, or discontinuing additional services like TV subscriptions. Churn can be costly. Retaining an existing customer is generally much cheaper than acquiring a new one. Understanding which customers are at risk of leaving can be crucial to implementing proactive retention strategies.
The Importance of predicting Churn
Predicting churn allows companies to
- Improve business strategies: By understanding churn drivers, businesses can work on the root causes of churn, such as improving service quality or adjusting pricing models.
- Identify at-risk customers: By using data to predict which customers are likely to leave, companies can intervene early
- Offer personalised retention efforts: Proactive engagement strategies (ex. discounts, service improvements) can be tailored to high-risk customers
Churn Prediction
To effectively predict churn, we must first gather and anayse relevant data. In this example, we’ve used a customer churn dataset, which includes several features like customer tenure, service usage, payment methods and contract types. Here’s a quick rundown of the process:
Data Collection and Preprocessing: The first step in collecting customer data, which often includes:
- Demographic information (age, location)
- Subscription details (contract type, payment method)
- Service usage data (monthly charges, tenure, total spending)
- After collecting the data, its cleaned and transformed into a format suitable for machine learning
This includes dealing with missing values, encoding categorical variables, and scaling numerical features.
Exploratory Data Analysis (EDA): EDA is crucial for uncovering patterns and trends within the data. Key findings can include:
- Churn Distribution: How many customers have churned versus remained
- Key Correlations: Identifying features that correlate with churn, such as shorter customer tenure, high monthly charges, and month-to-month contracts
Feature Selection:
- Final list of features selected after encoding:
- [‘gender’, ‘under_30’, ‘senior_citizen’, ‘dependents’, ‘referred_a_friend’, ‘phone_service’, ‘multiple_lines’, ‘avg_monthly_gb_download’, ‘online_security’, ‘online_backup’, ‘streaming_music’, ‘paperless_billing’, ‘churn_label’, ‘cltv’, ‘tenure_months’, ‘monthly_charges’, ‘population’, ‘country_united_states’, ‘internet_type_cable’, ‘internet_type_dsl’, ‘internet_type_fiber_optic’, ‘payment_method_bank_withdrawal’, ‘payment_method_credit_card’, ‘payment_method_mailed_check’, ‘quarter_q3’, ‘device_protection_no’, ‘device_protection_yes’, ‘tech_support_no’, ‘tech_support_yes’, ‘state_california’, ‘city_encoded’, ‘longitude_encoded’]
Building the Churn Prediction Model:
- We used machine learning algorithms such as XGBoost, CatBoost to predict churn
- These models are trained on historical data and tested on a hold-out dataset to ensure generalisability
Model Evaluation: After training the model, we assess its performance using key metrics like:
- Accuracy: The proportion of correct predictions
- AUC-ROC: A metric that evaluates the model’s ability to distinguish between churn and non-churn customers
- Precision and Recall: These metrics help assess how well the model identifies actual churn customers, minimising false positives and false negatives.
In our case, after running the models, we achieved the following results:
- XGBoost: AUC-ROC = 0.82, Log Loss = 0.44
- CatBoost: AUC-ROC = 0.83, Log Loss = 0.43
Upon adding additional features:
- XGBoost – ROC AUC: 0.865, Log Loss: 0.391
- CatBoost – ROC AUC: 0.873, Log Loss: 0.380
The table below summarises the performance metrics for the classifiers:
Key Classification Metrics:
Class 0: The customer did not churn
Class 1: The customer did churn
- Precision: Measures the accuracy of positive predictions.
- Recall: Measures how well the model captures all actual positive cases.
- F1-Score: A balance between precision and recall. It is the harmonic mean of precision and recall.
- Support: Number of occurrences of each class in the dataset (0 and 1).
- Accuracy: Overall accuracy of the model.
- AUC-ROC Score: Area Under the Curve for the Receiver Operating Characteristic.
So, when you see terms like “Precision (0)” and “Precision (1)”, they refer to the precision of the model for class 0 and class 1 respectively. Similarly, “Recall (0)” and “Recall (1)” represent how well the model identifies class 0 and class 1 instances.
Apply the SHapley Additive exPlanations
SHAP (SHapley Additive exPlanations) values are a powerful method for interpreting machine learning models, especially in churn prediction. They help us understand how different features influence the model’s decision for each individual customer.
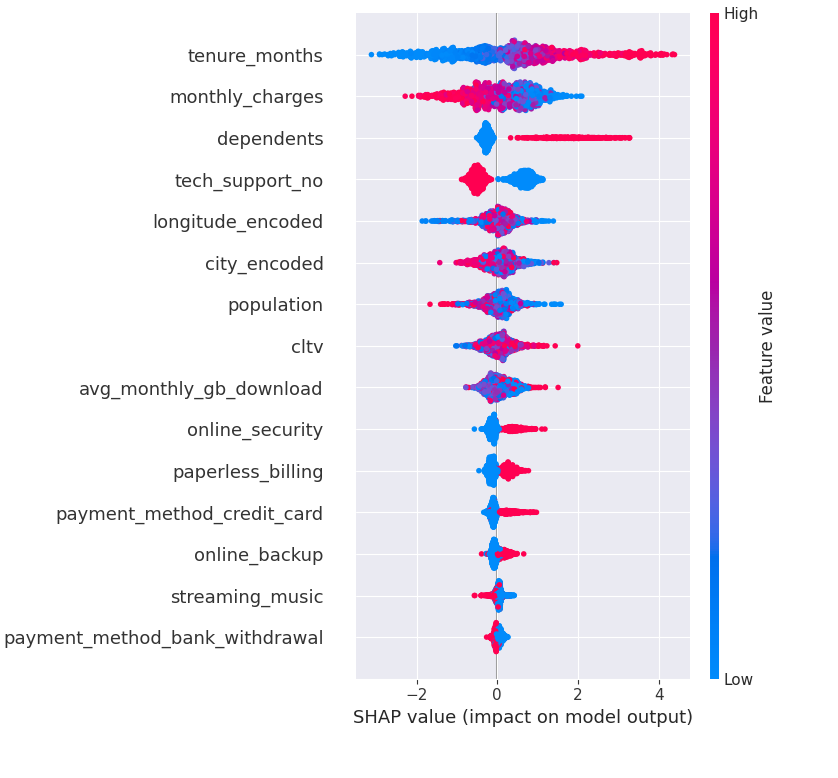
Key Feature Insights
- Tenure Months (tenure_months): Customers with longer tenure (blue) are less likely to churn (negative SHAP values), while those with shorter tenure (red) are more likely to churn.
- Monthly Charges (monthly_charges): Higher charges (red) tend to increase the likelihood of churn.
- Dependents: Having dependents (high feature value) seems to lower churn probability.
- Tech Support (tech_support_no): Customers without tech support (red) have a higher chance of churning.
- Paperless Billing: Customers using paperless billing (red) show a tendency toward higher churn.
- Payment Method (payment_method_bank_withdrawal): Customers using bank withdrawal tend to have higher churn risk.
Conclusions:
Based on the SHAP analysis, here are strategic recommendations to reduce customer churn:
- Service Duration Incentives: Reward long-term customers with loyalty programs, special first-year support, and milestone-based rewards.
- Pricing Optimization: Restructure high charges, introduce tiered pricing, offer bundled services, and promote multi-year contract discounts.
- Family-Focused Solutions: Develop family plans and packages, introduce family-specific benefits, and offer extra value for adding family members.
- Technical Support Enhancement: Improve support accessibility, offer proactive help, consider 24/7 support, and provide self-service resources.
- Engagement Strategies: Increase adoption of underused services, educate customers, send usage tips, and create an effective onboarding program.
- Payment and Billing Improvements: Encourage paperless billing with incentives, offer multiple payment options, provide annual prepayment discounts, and ensure clear billing practices.